PlotterBench
Can coding agents recreate financial widgets from a screenshot?
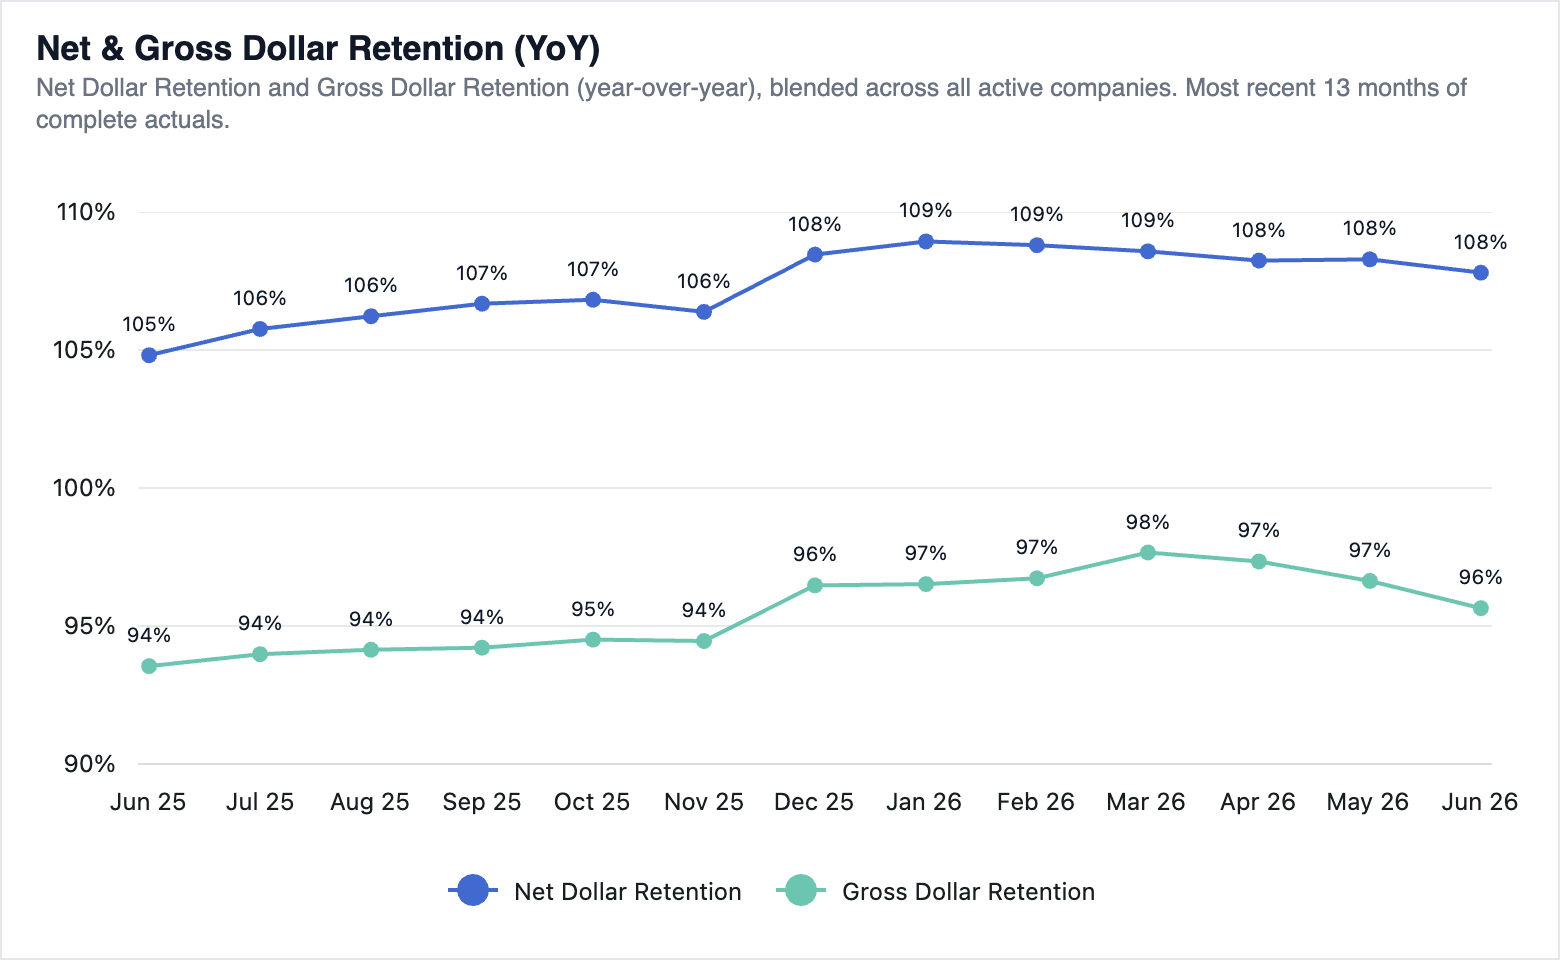
Based on reporting widgets from a proprietary financial analysis platform and framework for a private equity business, PlotterBench asks agents to rebuild a live financial chart from a screenshot. The agent has to work out the metric, time grain and reporting window from the image and express them as SQL and a chart config. We grade what the chart draws, and each task represents a distinct graph input.
- Tasks
- 10
- Public tasks
- 10
- Models evaluated
- 4
- Trials
- 40
Benchmark view
Model leaderboard
Average score across tasks, with each task weighted equally.
- Mean reward
- Average of task means across versions matching the dataset’s rules.
- ± SE
- Standard error across task means; directional with few tasks.
- Muse Spark 1.3 Contributoropencode · opencode · 1.18.1170.9%± 7.6 pp SETask means: 30.7%, 35.0%, 56.0%, 58.0%, 84.0%, 84.0%, 88.0%, 89.7%, 91.0%, 93.0%.
- GPT 5.6 Solopenai · opencode · 1.18.1159.3%± 8.3 pp SETask means: 51.0%, 67.5%.
- gemini-3.1-pro-previewgoogle-vertex · opencode · 1.18.1140.8%± 8.8 pp SETask means: 32.0%, 49.5%.
- GPT 5.6 Lunaopenai · opencode · 1.18.1139.0%± 7.0 pp SETask means: 32.0%, 46.0%.
Bars use a fixed 0–100% scale. Ticks mark each task mean.
Anatomy of a task
How PlotterBench works
1 · The agent gets a screenshot
A real reporting-pack chart, recreated in an anonymized environment. The instruction is a few sentences; house conventions live in the repo docs.
2 · It ships a widget definition
One JSON object against a typed widget contract: a SQL query over the warehouse plus serializable AG Charts config. Every key the config references must come out of the query.
{
  "widgetId": "agChart",
  "config": { "chartOptions": {
    "axes": { "y": { "label": { "format": ".0%" } }, … },
    "series": [ { "type": "line",
      "xKey": "periodLabel", "yKey": "ndr",
      "stroke": "var(--chart-series-1)",
      "appLabel": { "valueKey": "ndrLabel" } }, … ]
  } },
  "query": { "text": "with coverage as (
    -- latest month every company has actuals
    … ) select … from metrics.metric_points" }
}
3 · Grading is what the chart draws
Execute → Extract → Compare → Perturb
Both definitions run against the same warehouse and are compared by what they render; then new data lands and both re-run. Below: gpt-5.6-luna scoring 0.28.
Result 
Expected 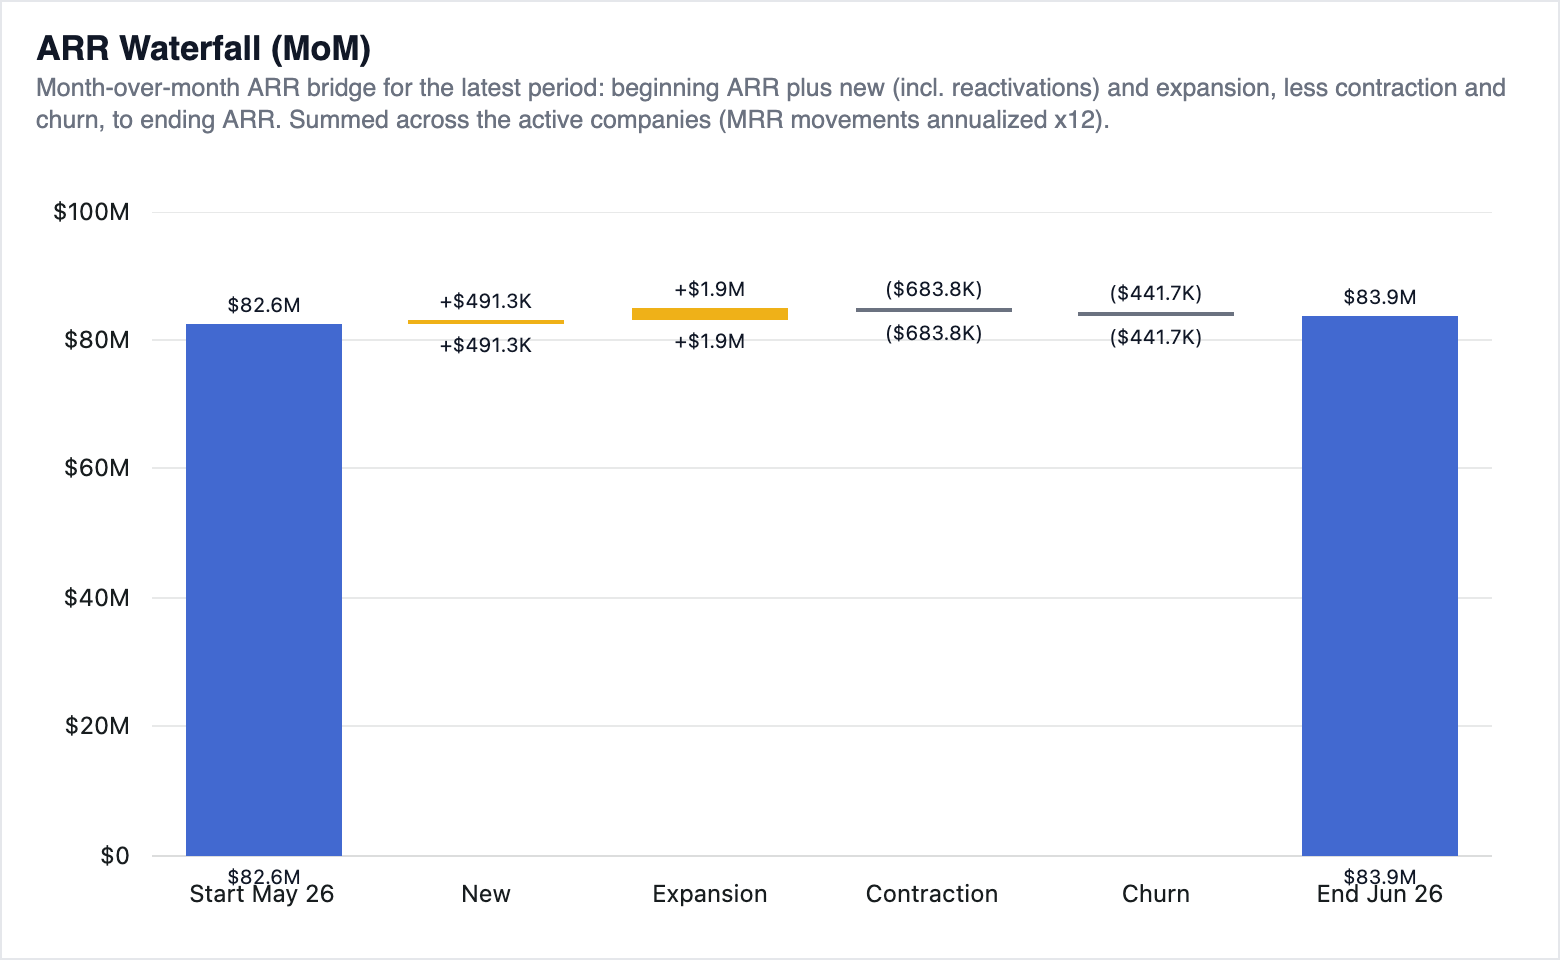
Current evidence
Task breakdown
Average scores across matching versions of each public sample. The dataset leaderboard also includes private tasks.
| Task | gemini-3.1-pro-previewgoogle-vertex · opencode · 1.18.11 | GPT 5.6 Lunaopenai · opencode · 1.18.11 | GPT 5.6 Solopenai · opencode · 1.18.11 | Muse Spark 1.3 Contributoropencode · opencode · 1.18.11 |
|---|---|---|---|---|
| pe-widget-arr-aggregateBrowse version 0.1.0 · 410e02d6 | — | — | — | 93.0%± 0.0 pp SE3 attempts |
| pe-widget-arr-per-customerBrowse version 0.1.0 · afdae1fd | — | — | — | 84.0%± 0.0 pp SE3 attempts |
| pe-widget-arr-waterfall-momBrowse version 0.1.0 · e0dcdb3f | 32.0%± 0.0 pp SE2 attempts | 32.0%1 attempt | 51.0%± 19.0 pp SE2 attempts | 30.7%± 1.3 pp SE3 attempts |
| pe-widget-logo-growthBrowse version 0.1.0 · c89f078d | — | — | — | 84.0%± 0.0 pp SE3 attempts |
| pe-widget-ndr-gdrBrowse version 0.1.0 · d6b04ef4 | — | — | — | 91.0%± 0.0 pp SE3 attempts |
| pe-widget-new-expansion-arrBrowse version 0.1.0 · 44e642d9 | — | — | — | 89.7%± 1.7 pp SE3 attempts |
| pe-widget-opex-mixBrowse version 0.1.0 · 5f8a87a2 | 49.5%± 3.5 pp SE2 attempts | 46.0%1 attempt | 67.5%± 21.5 pp SE2 attempts | 58.0%± 29.1 pp SE3 attempts |
| pe-widget-opex-revenueBrowse version 0.1.0 · 6a6e7cdf | — | — | — | 56.0%± 28.0 pp SE3 attempts |
| pe-widget-quarterly-opexBrowse version 0.1.0 · 1b4ad992 | — | — | — | 88.0%± 2.1 pp SE3 attempts |
| pe-widget-rule-of-40Browse version 0.1.0 · 5d87d79f | — | — | — | 35.0%± 0.0 pp SE3 attempts |