Public task
pe-widget-ndr-gdr
Recreate a PE portfolio retention graph from a screenshot using the widget DSL and data warehouse.
Part of PlotterBench ↗
- Model configurations
- 1
- Evaluation attempts
- 3
- Public examples
- 3
Current task results
Evaluation comparison
Published evaluation results for this task version. Each bar shows a model configuration’s average score.
| Model | Average score | Score range | Attempts |
|---|---|---|---|
| Muse Spark 1.3 Contributoropencode · opencode · 1.18.11 | 91.0%± 0.0 pp SE | 91.0% – 91.0% | 33 scored |
Averages and ranges use scored attempts on this exact version. Attempts without a score are counted separately. SE measures uncertainty across attempt scores.
The task
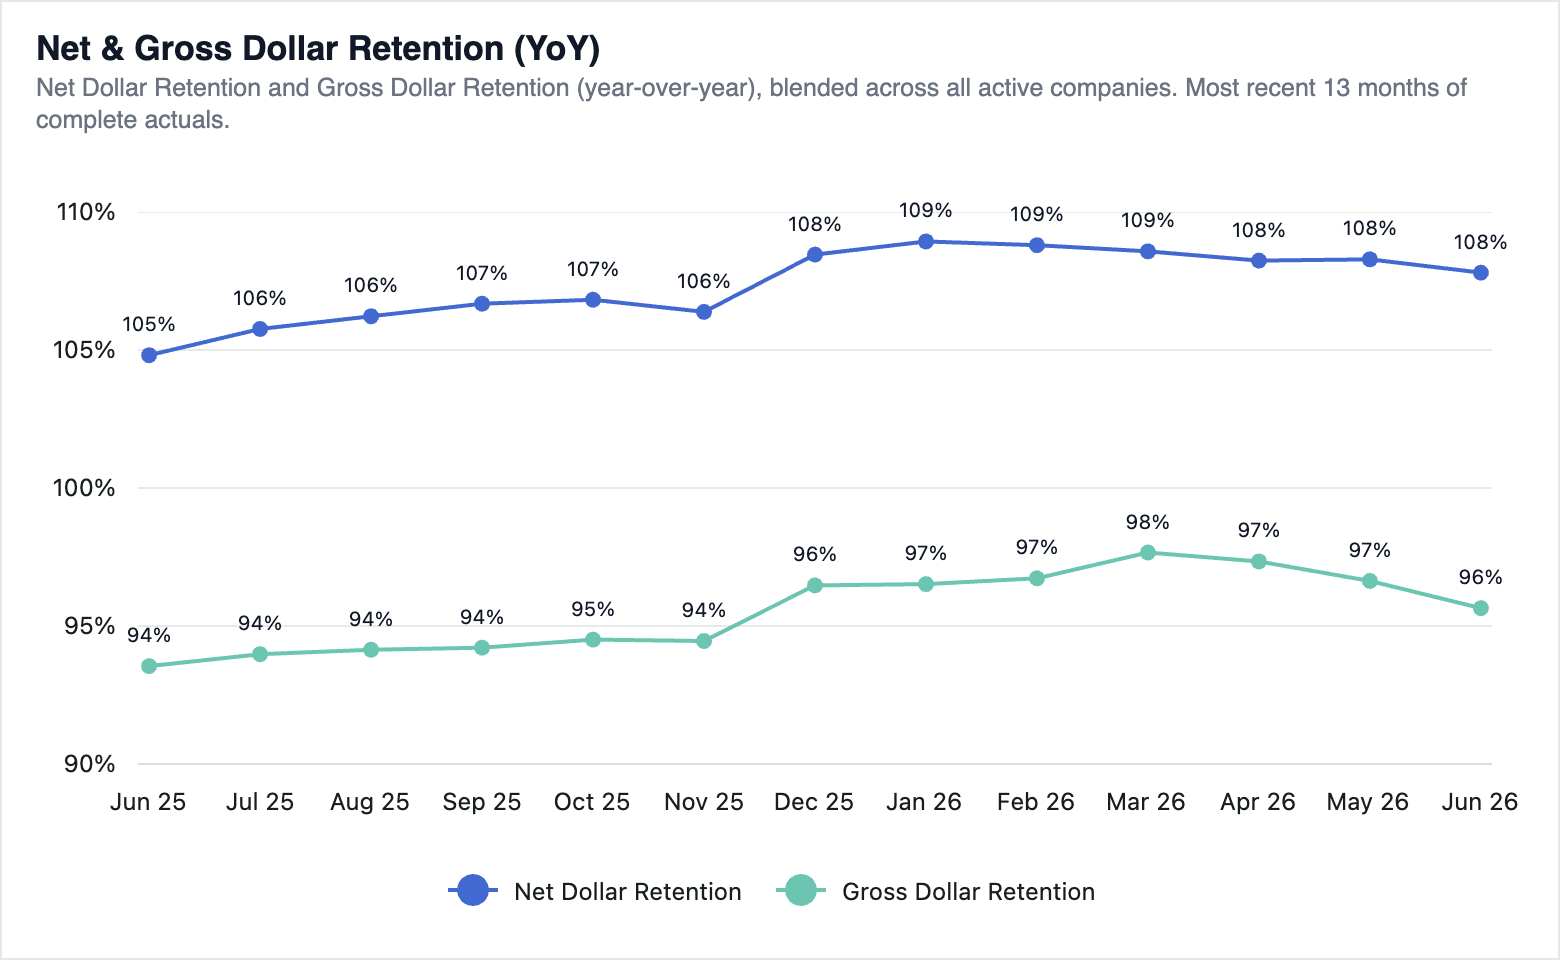
What the agent receives# Recreate the Net & Gross Dollar Retention graph from the reporting pack The portfolio's monthly reporting pack includes the graph shown in `assets/target.png`: Net Dollar Retention and Gross Dollar Retention (year-over-year), blended across all active portfolio companies. Recreate it as a standalone graph definition at `graphs/ndr-gdr.json`, using the warehouse data and the graph definition contract and house conventions documented in `contracts/README.md`. The graph takes no dashboard parameters. Match the chart as rendered: its data, point labels, legend, axes, and theme colors. The definition must keep producing the correct reporting window as new monthly actuals land, without further edits. Check your work with `node contracts/validate.mjs graphs/ndr-gdr.json`.